Introduction

This text is meant to provide a quick overview of some useful facts about parameters that play a role in displacement processes. The following items will be reviewed: wettability, permeability, relative permeability, capillary pressure, end-point mobility ratio and shock-front mobility ratio. In addition, capillary and Bond number, and the spreading coefficient will be shortly reviewed. For a detailed discussion, the interested reader is referred to standard textbooks like Fundamentals of Reservoir Engineering by Dake [1] and references therein.


Wettability

Wettability describes the relative preference of a rock to be covered by a certain phase. Rock is defined to be water-wet if the rock has (much) more affinity for water than for oil. In that case, a major part of the rock surface in the pores will be covered with a water layer. Clearly, wettability will be affected by the minerals present in the pores. Clean sandstone or quartz is extremely water-wet, but sandstone reservoir rock is usually found to be intermediate-wet. Intermediate wettability means that some pores are water wet and other pores are oil wet. Carbonates are believed to be more oil-wet than clastics: a major part of the rock surface in the pores is then covered with oil. It should be stressed that in practice extreme water-wetness or extreme oil-wetness is rare. Only for gas-liquid systems, one can safely assume that gas is always the non-wetting phase.
Basic reservoir properties like relative permeability, capillary pressure and resistivity depend strongly on wettability. It is therefore important that laboratory experiments in which these properties are measured are carried out on samples whose wettability is representative of the reservoir from which they are taken. Since no well-established techniques exist at present for downhole measurement of the wettability of reservoir material, it is not possible to state categorically whether a certain wettability is representative in a given case. In the laboratory, wettability is characterised usually by the so called Amott and USBM indices. These indices are derived from capillary pressure measurements, further discussed below.


Residual saturations

As mentioned above, in an extremely water-wet rock, the surface is covered with water. In that case oil (or gas) will be located in the centre of the pores. In the laboratory, when water-filled water-wet rock is brought to irreducible or connate water saturation (Scw) by oil flooding, this water will remain a continuous phase covering the pore walls. Therefore, in theory, by ongoing oil flooding of a perfect water-wet rock it is possible to "scratch-out" the last bit of water, albeit at infinitely long displacement time, so that Scw=0 for a perfect water-wet system. Consequently, for reservoir rock, a general feature of water-wetness is that Scw is low, say 10% or so of the pore space. During a subsequent water-drive to produce the oil, a significant amount of oil eventually will remain capillary trapped, floating as disconnected blobs in the centre of the pores. The residual oil saturation Sor is determined by the topology of the pore space and is usually higher than Scw: around 30% and up. In an oil-wet system, water and oil can be thought to exchange places when compared with a water-wet system. Therefore, in oil-wet rock, the residual oil saturation Sor is low, about 10% of the pore space, and Scw will be higher. As is demonstrated by the simulations, in the laboratory it is difficult to attain connate water and residual oil saturations in actual experiments. In practice, only remaining saturations are reached, due to a capillary end-effect or due to an extremely small mobility of the displaced phase.


Capillary pressure

Capillary pressure pc is defined as the pressure difference between the non-wetting phase and the wetting phase as a function of the (wetting phase) saturation. For oil/water systems in porous rock, oil is in general considered to be the least wetting phase. Therefore, we will define the capillary pressure as:
p<SUB>c</SUB>(S<SUB>w</SUB>) = p<SUB>o</SUB>(S<SUB>w</SUB>) - p<SUB>w</SUB>(S<SUB>w</SUB>) (1)

In reservoir engineering, pc is an important parameter for simulation studies (in particular for heterogeneous systems). In most studies, the inflow of water needs to be modelled, so particularly the imbibition capillary pressure is of importance. Note that an Hg-air measurement will result in the primary drainage curve and that this data is only used in the initialisation of a simulation model.

Figure 1 Full capillary pressure curve; 1st drainage, 1st imbibition and 2nd drainage.

Fig. 1 shows a typical capillary pressure curve for a water-oil system in a porous rock. The capillary pressure curve consists of three branches: a primary drainage, a primary imbibition and a second drainage branch. Below we will discuss these branches in some detail.
1st-Drainage
At Sw=1, the start of the 1st drainage, an "entrance" pressure needs to be exceeded before oil can enter the sample. Then a plateau is reached. At decreasing water saturations, the capillary pressure rises to very high values. This means that when oil is injected into this system, an ever higher injection pressure is required to force the next bit of water out. The capillary pressure goes to infinity at the connate water saturation Scw (Fig. 1).
1st-Imbibition
When the oil pressure is slowly decreased, water will spontaneously imbibe and the saturation will increase. The capillary pressure decreases, and is in general smaller than the drainage capillary pressure for the same saturation, an effect called capillary hysteresis. When the oil pressure is equal to the water pressure (pc=0), the saturation reaches the spontaneous water imbibition saturation Sspw. Increasing the saturation from this point can only be accomplished by forcing the water in, hence by increasing the water pressure above the oil pressure. By definition, the capillary pressure becomes negative (Eq. 1). An ever higher water pressure is required to force the next bit of oil out, until the residual oil saturation Sor has been reached. Note that pc goes to minus infinity at water saturations near Sw=1-Sor (Fig. 1). In conclusion, a negative capillary pressure means nothing else than that a larger water injection pressure than the oil-phase pressure has to be applied to remove oil from the sample (see Eq. 1).
2-nd Drainage
When the water pressure is slowly decreased, oil will spontaneously imbibe and the saturation will decrease. The capillary pressure increases, and will in general be larger than the imbibition capillary pressure for the same saturation, as a result of the capillary hysteresis. At pc=0 the capillary pressure curve crosses the spontaneous oil imbibition saturation Sspo. Increasing the oil pressure (and thus pc), leads to a decrease of the water saturation (forced drainage). Around Scw the capillary pressure becomes infinitely large.
Wettability
As already discussed above, wettability determines the distribution of oil and water in the porous rock, and directly affects parameters like connate water and residual oil saturation. Obviously, the capillary pressure also depends strongly on the wettability. In the extreme water-wet situation, the drainage as well as the imbibition capillary pressure are positive over the whole saturation range from Scw (small) to Sor (large). Water will spontaneously imbibe from Scw to 1-Sor. A kind of inverse situation holds for an extremely oil-wet system; the drainage as well as the imbibition capillary pressure are negative. In addition a small Sor and a large Scw are typical. Here, oil will spontaneously imbibe from Sor to 1-Scw.
As already mentioned above, extreme water or oil wetness is rare. Most reservoir rock is intermediate wet, with Scw and Sor roughly equal. For the intermediate-wet case, the spontaneous imbibition saturation for water Sspw and oil Sspo (where pc=0) lie somewhere in between Scw and 1-Sor.
In line with conventional definitions, we will denote by imbibition: increasing water saturation; and by drainage: decreasing water saturation, irrespective of the wettability.
Note that normally for imbibition UnSteady State experiments, water is injected at the bottom of the plug, while for drainage the oil is injected from the top to ensure gravity stable displacement in vertical plugs. SCORES chooses injected phase and inflow face automatically, based on the choice for imbibition or drainage.
Wettability indices
The direct effect of wettability on capillary pressure has prompted several investigators to define a wettability number. We will discuss here the Amott index and the USBM index, the two mostly used indices. However, it should be stressed that (i) these numbers capture only part of the shape of the curves and (ii) for the description of displacement processes, the complete relative permeability and capillary pressure curves are required, instead of a single wettability index. Wettability indices may give only an (incomplete) wettability characterisation of rock, but still can be useful in the design of correlations.

Figure 2 Imbibition and drainage capillary pressure curve, required to determine the Amott and USBM wettability indices.

The Amott index is based on the amount of spontaneous imbibition of a certain phase. For water, the Amott index Iw is defined as (see Fig. 2) :
(2)

Similarly, the Amott index for oil Io is defined as:
(3)

For an extremely water-wet system Io will be zero, while for an oil-wet system Iw equals zero. Clearly, the shape of the capillary pressure curve is not taken into account in the Amott index. A more "complete" wettability number is represented by the USBM number, which is defined as (see Fig. 2):

For an extremely water-wet system U is very large and positive, for an intermediate-wet U lies around zero and for an extremely oil-wet system U will be very large and negative. Finally, it should be mentioned that the USBM number defined above is usually referred to as the "modified" USBM index. The "standard" USBM index is calculated in an identical way from raw centrifuge capillary pressure data, using the average saturation instead of that at the inflow end. However, the raw data need considerable correction (saturation shift) before one arrives at a more truthful representation of pc.
Leverett-J
For modelling and correlation purposes the capillary pressure can be described by a dimensionless so called Leverett-J function:
(4)

with the interfacial tension between the two phases and the porosity of the rock.


Permeability

Permeability is the single-phase fluid conductivity of a porous material. The equation that defines permeability in terms of measurable quantities is Darcy's law. Consider an incompressible fluid, with viscosity mu, which is forced to flow, at flow rate q, through a porous medium, of length L and with cross section A, such that the pressure difference across the length of the porous medium is deltaP. Then the permeability K of the material is defined as:
(5)

The value of the permeability is determined by the structure of the porous rock. A tight rock, with small pore diameter will have in general a smaller permeability than a coarse rock with larger pores. From Eq. 5 it is seen that K has dimensions of length squared. The unit most widely employed for the permeability is the Darcy (D); 1 D is about (1mum)2 = 10-12 m2.


Relative permeability

In case of two or more fluids flowing simultaneously through a porous medium, a relative permeability for each of the fluids can be defined. It describes the extent to which one fluid is hindered by the other. The relative permeability is defined by setting-up the Darcy equation individually for each phase i that flows in the pore space:
(6)

with qi being the flow rate of phase i, kri the relative permeability of phase i, mui the viscosity of phase i and deltapi the pressure drop within phase i. The term in brackets is denoted the "mobility" of phase i.
In the industry, several different definitions are in use for the normalisation of kr: the most common being that kriK represents the total permeability of phase i. This is the definition used in the Shell Group outside the USA. An other definition relates the phase permeability of each phase to the respective end-point permeability: kro is normalised to kro at connate water saturation (kro,cw=kro(Scw)) and krw to krw,or (=krw(Sor)). Finally, a definition exists in which both the wetting and the non-wetting phase relative permeability are normalised to kro,cw.
The usual assumption is that kri is a function of the saturation of phase i and constitutes a rock property (i.e. kri is independent of the fluids used, except for a characterisation of wetting vs. non-wetting). It turns out that for two-phase systems with a normal interfacial tension (sigma about10 mN/m or more), this is a good approximation.
Wettability
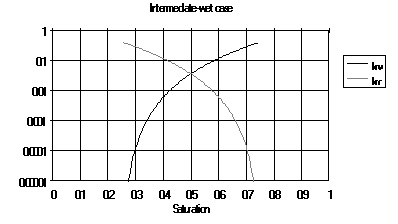
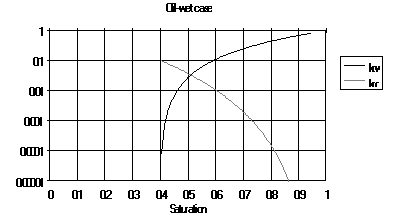
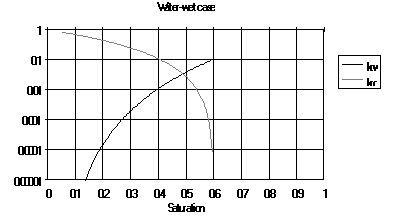
As discussed above, the wetting phase covers the walls of the pores and will flow along the walls through a more-or-less thin liquid "sheet". A non-wetting phase flows in the centre of the pore space, as a flowing tubular, not touching the walls. For that reason, the relative permeability of the wetting phase at residual non-wetting phase saturation is much smaller than the relative permeability of the non-wetting phase at the irreducible wetting-phase saturation. The typical shapes of the relative permeabilities for water-wet, oil-wet and intermediate-wet systems are shown in Fig. 3.


Figure 3 Typical shapes of the oil and water relative permeability for water-wet, intermediate-wet and oil-wet conditions.

A well-known model of the water and oil relative permeability functions is the Corey-exponent representation:
(7)

with krw,or and kro,cw the end-point relative permeabilities, and nw and no the so called Corey exponents for water and oil respectively. For a water-wet system, the oil relative permeability is characterised by a residual oil saturation Sor of 30 % or higher, a Corey exponent no around 2 - 3 and an end-point relative permeability kro,cw around 0.6 - 0.8. The corresponding water relative permeability is characterised by a connate water saturation Scw of some 10 %, a Corey exponent nw around 4 - 6 and an end-point relative permeability krw,or around 0.1 - 0.4. For an oil-wet system water and oil exchange places. For the intermediate-wet case we expect both Scw and Sor to be around 20 %, no and nw to be around 3-5 and the end-points kro,cw and krw,or around 0.5 (Fig. 3).


Mobility ratios

When water displaces a high viscosity oil, frontal instabilities may be initiated by heterogeneities in the porous medium. In general, unstable displacement will result in the formation of so called viscous fingers. At present, no techniques are available, which allow the interpretation of unstable data. Therefore, in laboratory experiments, viscous fingering is undesirable. For a proper measurement of the relative permeabilities ("rock curves"), fingering should be avoided. Initially, the risk towards fingering was assessed by evaluating the so called end-point mobility ratio M:
(8)

with water being injected and oil being displaced. In Eq. 8, the relative permeabilities are taken at the end-point values (assuming that far away from the displacement front the fluids are at their end-point saturations, see Fig. 4).

Figure 4 Saturation profile in a de-saturated core plug flooded by water.

Instability was expected at M>1. Later Hagoort [2] argued that this criterion is too restrictive and should be replaced by the so called shock-front mobility ratio Ms:
(9)

Sf being the shock-front saturation (see [1]). Note that this expression represents the ratio of the total mobility just up-stream of the shock-front over the mobility down-stream of the shock-front. Instability, and hence viscous fingering, is now expected at Ms>1. It is of interest to note that it is quite possible to have Ms<1 at M about50 !


Bond and capillary number

Multi-phase flow through porous media is governed by the interplay between capillary, viscous and gravitational forces. The flow regime can be characterised by the capillary number Nc and the Bond number Nb, which we define as:
(10)

and
(11)

These numbers are dimensionless measures for the ratio of - viscous and capillary - and - gravitational and capillary - forces at the pore scale, respectively. Our definition of the capillary number Nc deviates from some formulations found in literature, yet assures that absolute numerical values of Nc and Nb are compatible (see [3] for an extensive discussion on capillary and Bond number).
Capillary forces usually dominate in reservoir flow. Therefore, although the actual flow is driven by viscous or gravitational forces, the flow paths at the pore scale are determined by the capillary forces. With increasing Nc or Nb, the viscous/gravitational forces may become comparable to the capillary forces at the pore scale. Flow paths may alter and thus the relative permeability. This change in flow dynamics is reflected as a capillary or Bond number dependence of the relative permeability. This dependence plays an important role in processes like for example developed near-miscibility and well impairment due to condensate drop-out. Mostly, however, this flow regime is not applicable to the field situation, and therefore should be avoided in laboratory experiments, if proper and reliable basic reservoir data are to be obtained. As a rule of thumb, Nc or Nb are not to exceed 10-5 for imbibition experiments. Literature data indicate that Nc should not exceed 10-3 during the drainage of the wetting phase. This is of particular importance when preparing samples at Swi, in primary drainage, when most samples are water-wet.


Spreading coefficient

For the design of representative gas-oil gravity drainage experiments, the spreading condition of the water-oil-gas system needs to be addressed. Following Adamson , [4] the spreading coefficient for fluid 2, between fluids 1 and 3, is defined as:

S2,13 = s13 - (s23 + s12),

with sij being the interfacial tension (IFT) between fluid i and j. For S2,13 >0, fluid 2 will spread between liquids 1 and 3; if S<0, fluid 2 will not spread between the two other fluids. Note that in a three-phase system, only one phase can be spreading at the time, but spreading does not have to occur .[5]
In the field, at reservoir conditions, the IFT between oil and gas typically is in the order of say 10 mN/m, the IFT between oil and water around 20 mN/m and the IFT between water and gas around 35 mN/m. Therefore So,wg amounts to some +5 mN/m and oil will spread between the gas and the water phase. Close to the critical point of the hydrocarbons, or of the total hydrocarbon-water system, the balance may change.
In the laboratory, the IFT between oil and gas typically is 25 mN/m, between oil and water some 30 mN/m and between water and gas the IFT is in the order of 50 mN/m. Therefore, So,wg will be around -5 mN/m and the oil is non-spreading. It is of interest to note that for distilled water, the IFT with air is about 70 mN/m, which would cause oil to spread. However, the water-gas IFT is affected significantly by the equilibration with the oil phase and this brings the IFT down to 50 mN/m or so.
Gas-oil gravity drainage experiments need to be carried out at representative wetting - and therefore: spreading - conditions. The synthetic oil soltrol is commonly used at laboratory conditions to achieve oil-spreading in gas-water.


References

[1] Dake, L.P., "Fundamentals of Reservoir Engineering", Elsevier Scientific Publishing Company, Amsterdam, 1977.
[2] Hagoort, J., "Displacement Stability of Water Drives in Water Wet Connate Water Bearing Reservoirs", Soc. Pet. Eng. J., February 1974, pp 63-74, Trans. AIME.
[3] Boom, W.,: "Experimental evidence for improved condensate mobility at near wellbore flow conditions", SPE.
[4] Adamson, A.W., "Physical chemistry of surfaces", 3rd Edition, John Wiley & Sons, New York, 1976.
[5] Boutkan, V.K., Private communication.


Nomenclature

Am2Cross sectional of the core plug
AoPaArea under the imbibition pc-curve between Sspw and 1-Sor
Aw PaArea under the imbibition pc-curve between Sspo and Scw
IoAmott index for oil
IwAmott index for water
g m/s2Centrifugal acceleration
Km2Permeability
kriRelative permeability for phase i
kroRelative oil permeability
kro,cwRelative oil permeability at connate water saturation
krwRelative water permeability
krw,or Relative water permeability at residual oil saturation
L mLength
MEnd-point mobility ratio
MsShock front mobility ratio
noCorey exponent for oil
nwCorey exponent for water
NbBond number
NcCapillary number
pcPaCapillary pressure
po PaOil pressure
pw PaWater pressure, wetting-phase pressure
pnw PaNon-wetting phase pressure
deltaPPaPressure difference
deltapiPa Pressure difference in phase i
qm3/sFlow rate
qi m3/sFlow rate in phase i
SwWater saturation
SoOil saturation
SfShock front saturation
ScwConnate water saturation
SorResidual oil saturation
SspoSpontaneous oil imbibition saturation
SspwSpontaneous water imbibition saturation
S1,23Pa.mSpreading coefficient of fluid 1 in between fluids 2 and 3
UUSBM wettability index
deltadifference indicator
phiPorosity
muPa.sViscosity
muiPa.sViscosity of phase i
sigmaPa.mInterfacial tension
rhokg/m3Density

THE LEGAL TERMS AND CONDITIONS APPLY TO THIS PAGE.